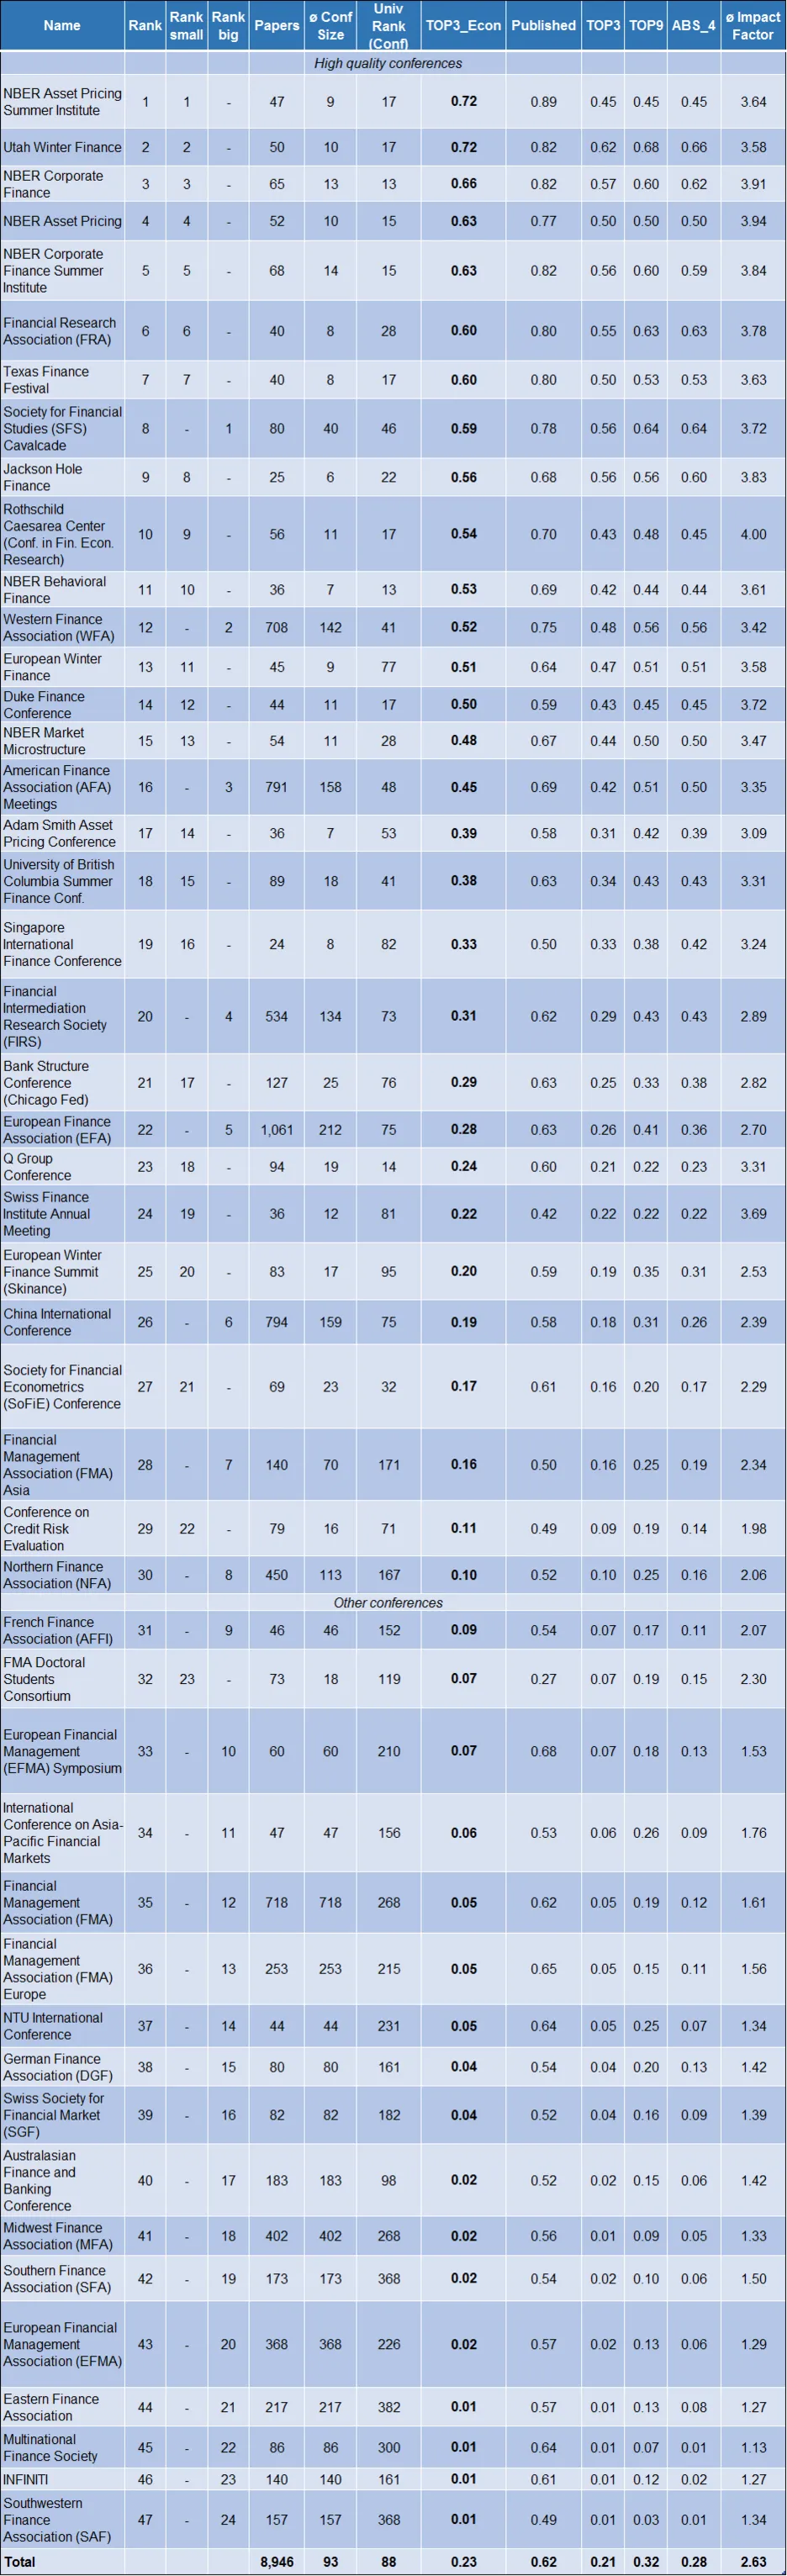
Table: Publication success of selected conferences
This table shows the ranking of 47 finance conferences. The first part of the table refers to the 30 best finance conferences for which we tracked papers presented at the respective conferences between 2006 to 2010. The only exception is the Society for Financial Studies (SFS) Cavalcade conference for which we used the programs of the first two conferences (2011 and 2012). The second part of the table shows larger, lower-ranked conferences, for which we only tracked papers from the 2008 conference programs. The only exception is the FMA Doctoral Students Consortium, for which we also tracked available conference programs from 2006 to 2010 due to its smaller size. Columns (2) to (4) provide the conference ranking according to column (8), i.e., the TOP3_Econ criterion, for all conferences, conferences with at most 30 accepted research articles, and conferences with more than 30 accepted research articles, respectively. Column (5) presents the total number of papers for a given conference that are in the dataset. Column (6) refers to the average conference size in terms of presentations. Based on this column, conferences are split into smaller and larger ones. For a given conference, column (7) is the median university rank of all papers on the program, where a paper's rank is defined as the best university rank across all coauthors, and an author's university rank is given by the average rank of the 2016 Academic Ranking of World Universities (Shanghai Ranking), the 2016 Times Higher Education World University Rankings, and the 2016/2017 QS World University Rankings. Observations are missing if no rankings are available for a paper. TOP3_Econ in column (8) is the fraction of research articles that have been published in the TOP3 finance journals or top economics journals (or have been accepted for publication in these journals) by October 2016. Column (9) represents the fraction of research articles that have been published or accepted in a journal by October 2016. Columns (10) and (11) represent the fraction of research articles that have been published or accepted in the TOP3 and TOP9 finance journals by October 2016. ABS_4 in column (12) is the fraction of research articles that have been published or accepted in category "4" finance journals according to the 2015 Association of Business Schools ranking. Column (13) shows the average impact factor of the journals at which research articles of the respective conferences have been accepted by October 2016. Journal impact factors (2011-2015) are taken from Thomson Reuters. The table is sorted in descending order according to column (8).